Channel IQ
Your sales and your website, in one view.
Channel IQ puts storefront sales beside website traffic: net sales, orders and customers next to visits, channels and landing pages. Dashboards and scheduled reports cover the weekly numbers, and plain-English questions cover the rest.
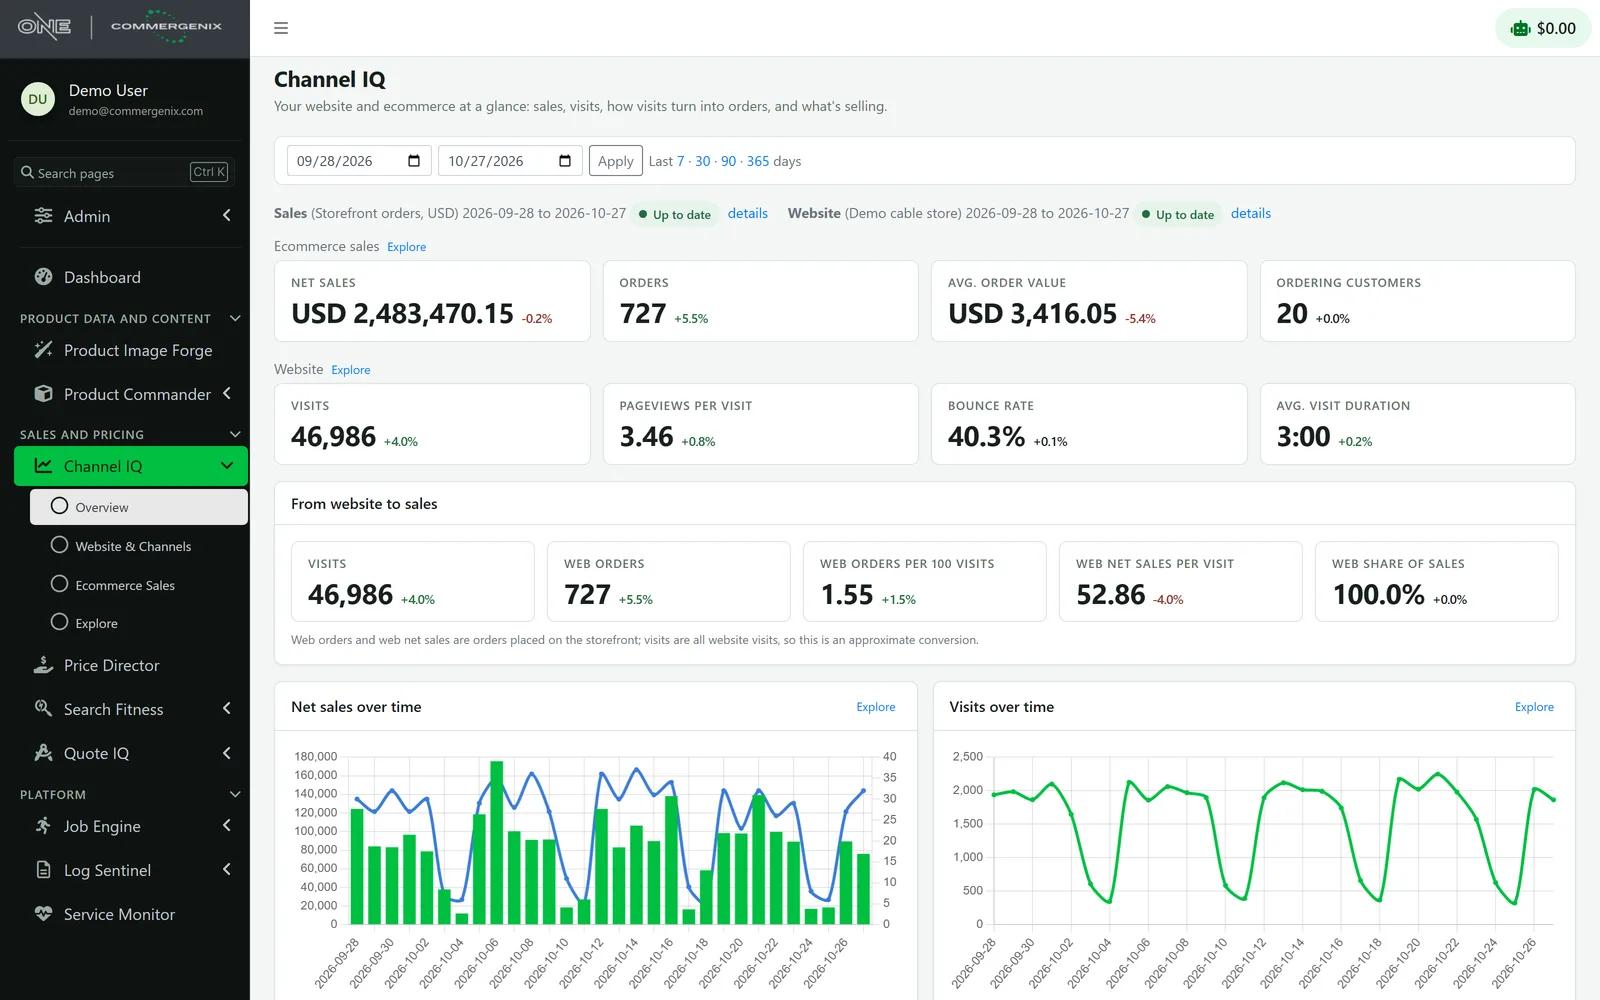
Sales and web traffic live in different tools.
Orders sit in the commerce platform and visits sit in web analytics. Seeing how one drives the other means toggling between systems and building the report by hand.
-
Two systems, two stories
The storefront knows what sold. Analytics knows who visited and where they came from. Neither one shows whether the traffic turned into orders.
-
Reports built by hand
Exports, spreadsheets and copy-paste every week, before anyone can start asking what changed.
-
New questions wait
Which channel brings the best customers? Which products sold more this quarter? Each new question becomes another report to build.
From your storefront and analytics to answers.
Channel IQ reads the systems you already run, keeps the numbers current, and puts sales and traffic side by side.
-
Connect your sources
Sales from Optimizely Configured Commerce, Shopify or nopCommerce. Web data from Matomo or Google Analytics.
-
Kept up to date
Data refreshes on a schedule, and every page shows whether it’s up to date and the dates it covers.
-
See it together
The overview lines up sales with visits: web orders per 100 visits, net sales per visit and the web share of sales.
-
Ask and explore
Ask a question in plain English, or build your own breakdown. Save it, export it, or add it to a dashboard.
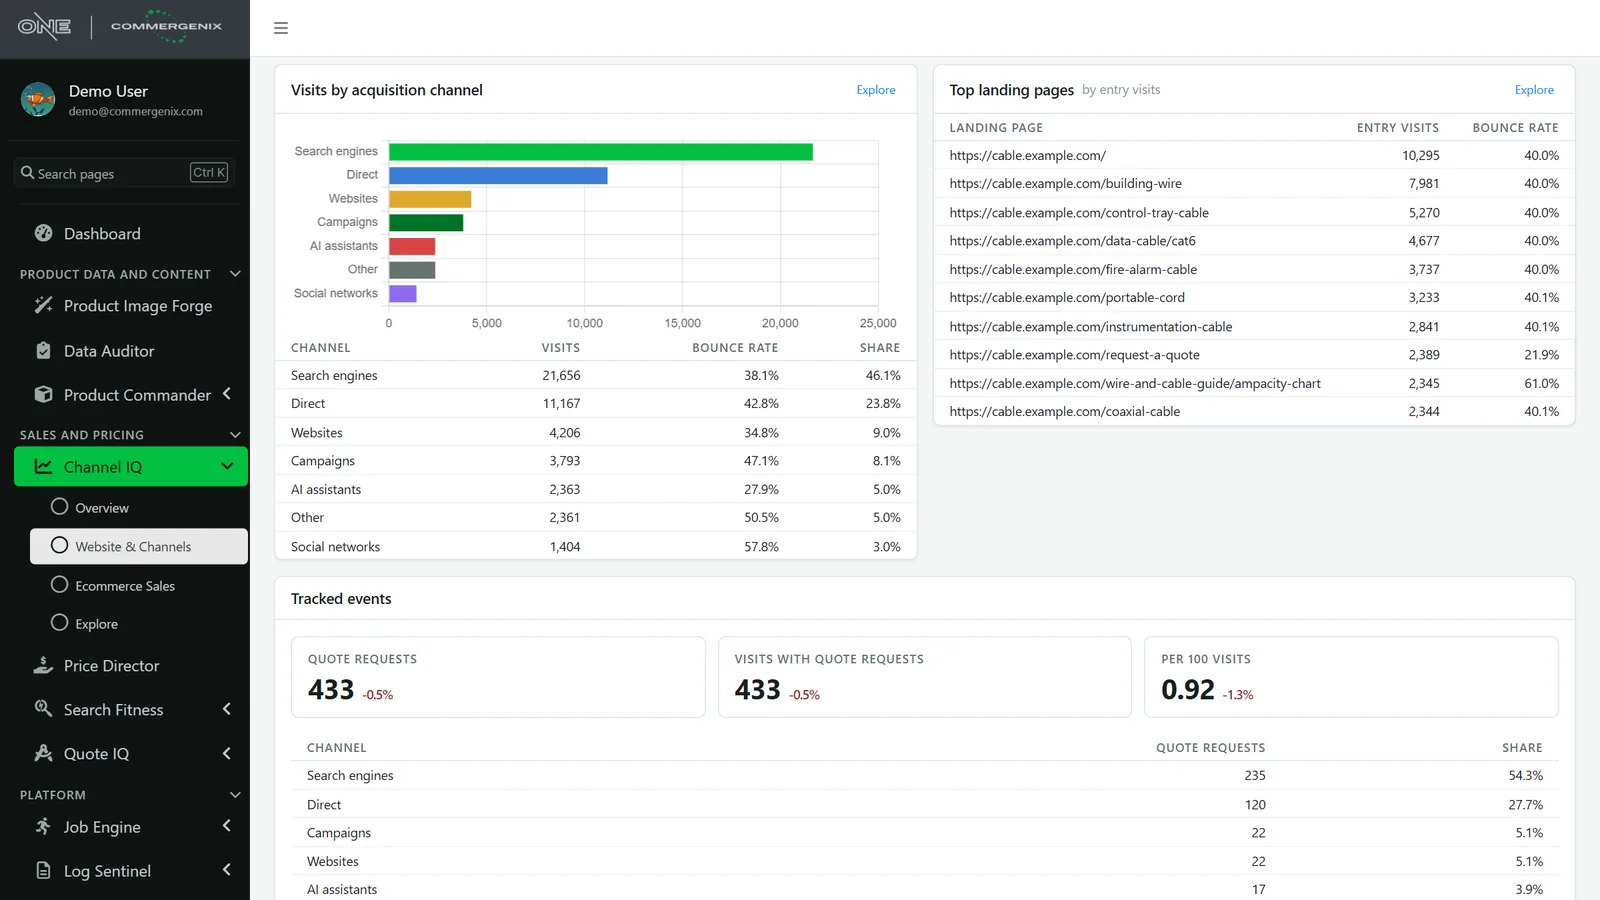
See which channels bring visitors, and what they do.
Visits by acquisition channel, from search engines, direct traffic and campaigns to AI assistants and social networks, each with its bounce rate and share of traffic.
- Top landing pages by entry visits, with each page’s bounce rate.
- Tracked events such as quote requests, counted per 100 visits and broken down by channel.
- Every figure compared with the previous period, so changes stand out.
Know what’s selling, and to whom.
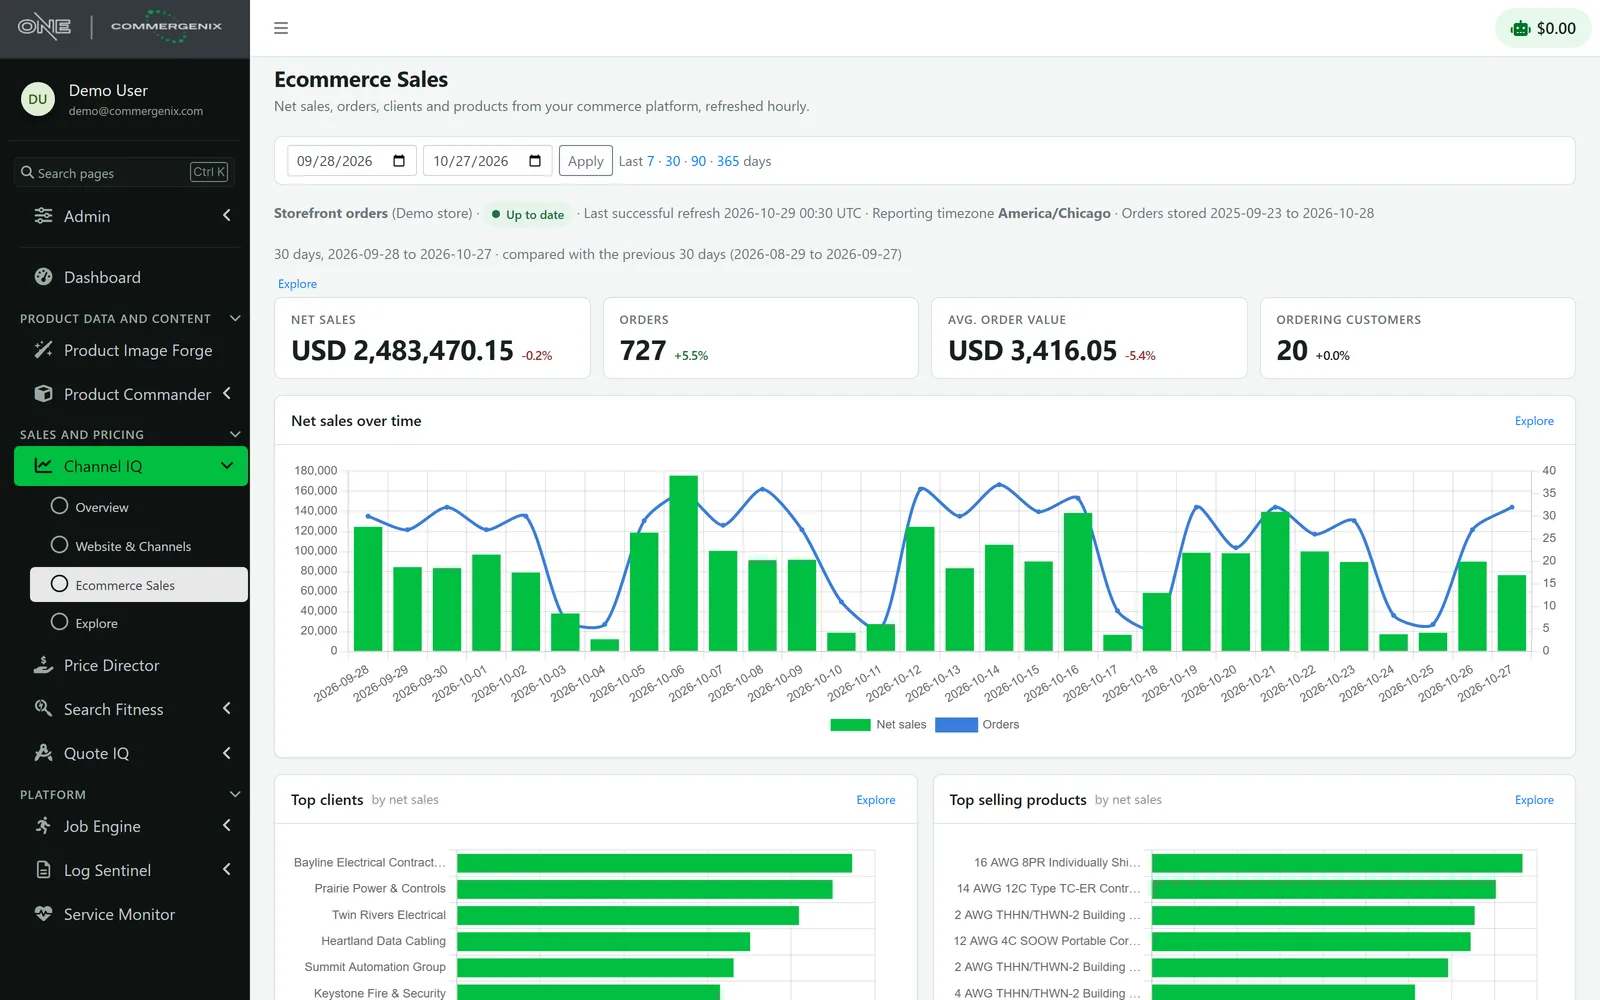
Net sales, orders, average order value and ordering customers from your commerce platform, refreshed hourly and compared with the period before.
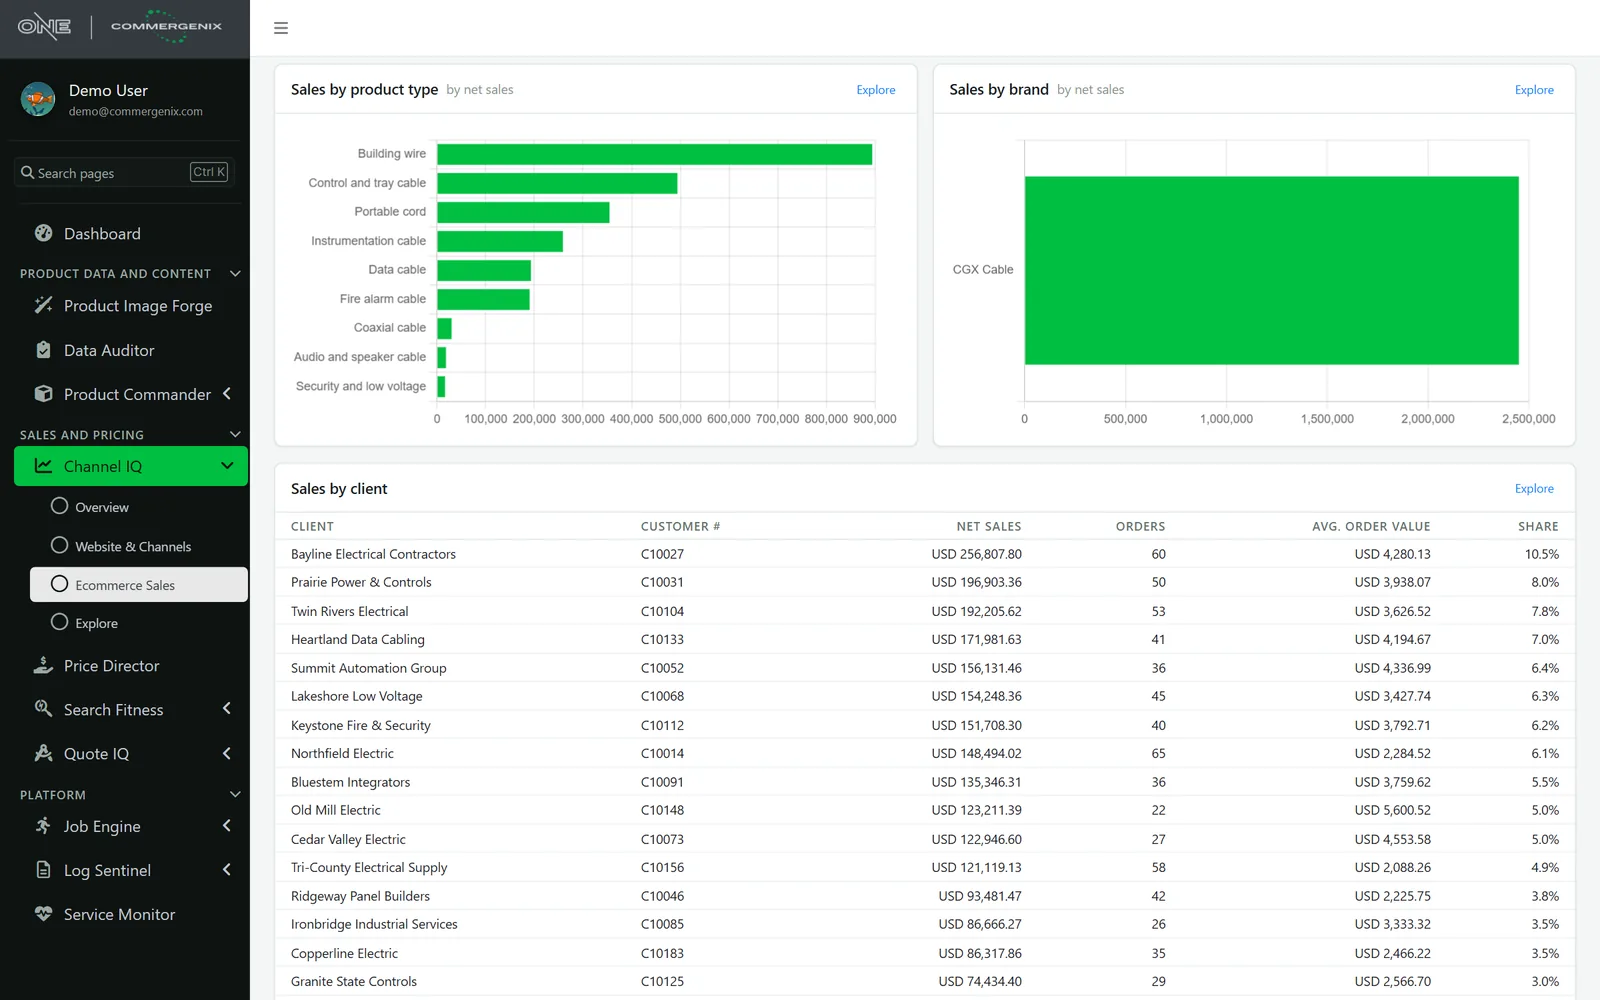
- Top clients and top-selling products by net sales.
- Sales by product type, brand and client, with orders, average order value and share for each.
- Net sales and orders over time, to spot growth, seasonality and declines.
Ask your own questions, in plain English.
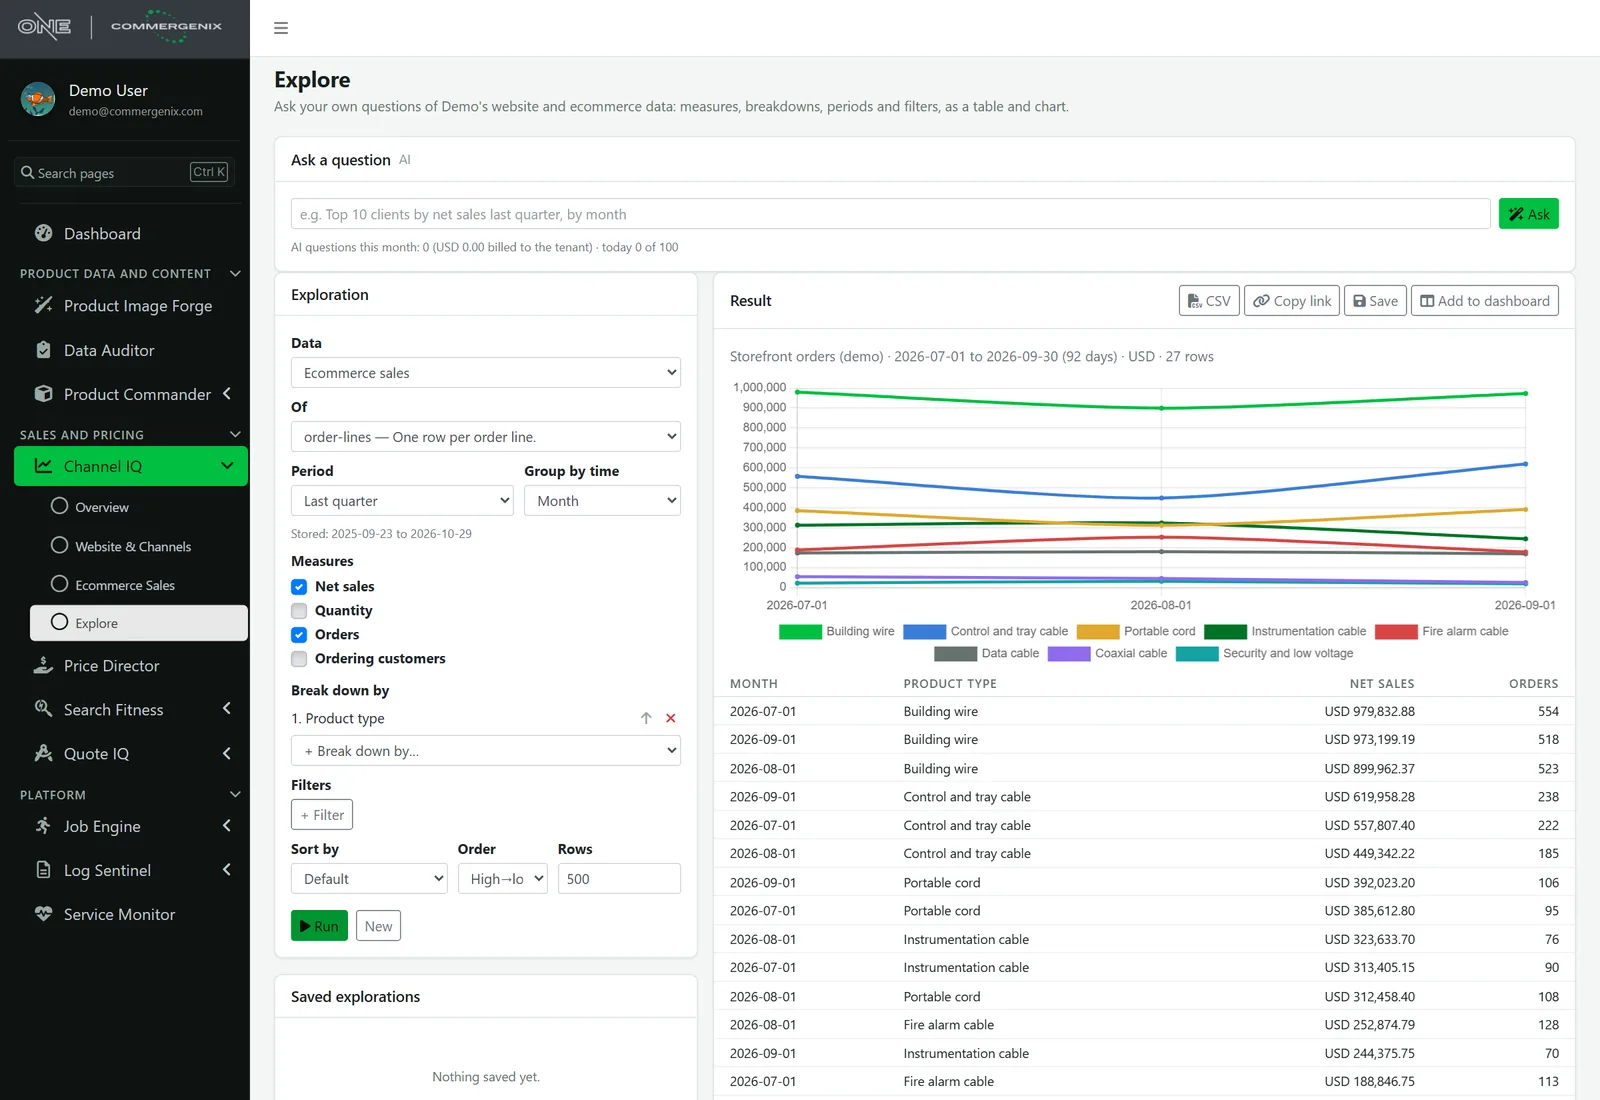
Type a question such as “top 10 clients by net sales last quarter, by month” and get a table and a chart. Or build it yourself: pick the data, measures, period, breakdowns and filters.
- Answers you can check: results come back as a table and a chart, from the same data as the dashboards.
- Keep what’s useful: save an exploration, copy a link to it, download it as CSV, or add it to a dashboard.
- AI use you can see: questions are counted each month, with a daily limit.
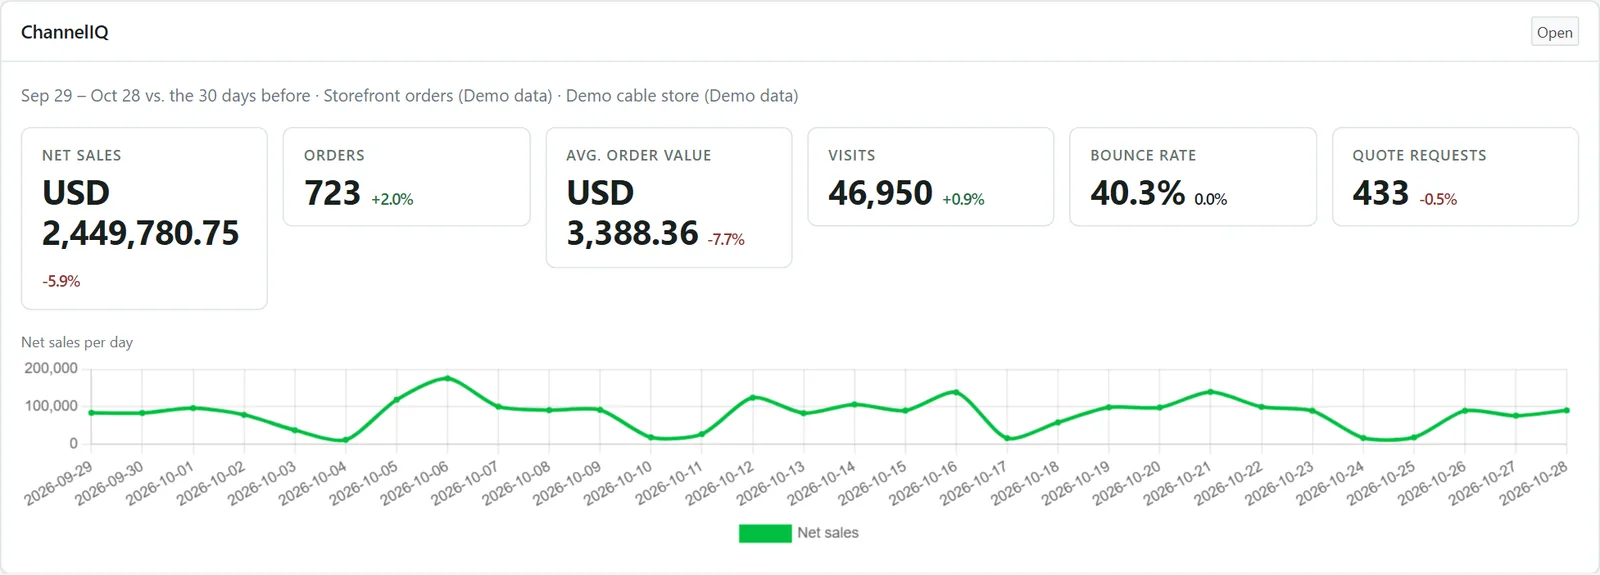
The numbers that matter, where you start the day.
The Channel IQ card on your Commergenix dashboard shows net sales, orders, average order value, visits, bounce rate and quote requests against the period before, with net sales per day.
Connected to the platforms you already run.
Channel IQ reads sales from your commerce platform and visits from your web analytics through Data Fabric, refreshed on a schedule. Running something not listed here? Tell us what you use.
 Optimizely Configured Commerce: sales
 Shopify: sales
 nopCommerce: sales
 Matomo: web analytics
 Google Analytics: web analytics
Numbers you can check, and answers that show their work.
Answers from your own data
A plain-English answer runs on the same sales and web data as the dashboards, and you read it alongside them.
Freshness on every page
Each source shows whether it’s up to date, when it last refreshed, and the dates it covers.
Clear comparisons
Every headline figure is compared with the period before, and the dates of both periods are shown.
Estimates labeled as estimates
Where a figure joins two systems, such as visits to orders, the page says it’s an approximate conversion.
AI use you can see
Plain-English questions are counted each month with a daily limit, and AI use stays inside your monthly budget.
Your data stays yours
Each customer’s sales and web data is kept separate from every other customer’s.
For teams who sell through a website and want to see what it’s doing.
Ecommerce and digital leaders
See whether traffic turns into orders, and which channels and landing pages bring buyers.
Sales leaders
Top clients, top products and sales trends, without waiting on a report.
Marketing teams
Which channels, from search and campaigns to AI assistants, bring visits and quote requests.
Common questions
Which platforms does Channel IQ work with?
Sales come from Optimizely Configured Commerce, Shopify or nopCommerce, and web data from Matomo or Google Analytics. If you run something else, tell us what it is.
How current are the numbers?
Data refreshes on a schedule. Every page shows whether each source is up to date, when it last refreshed, and the dates it covers.
Can I ask my own questions?
Yes. Ask in plain English, or build an exploration yourself from measures, periods, breakdowns and filters. Save the ones you use, export them as CSV, or add them to a dashboard.
Does AI change my numbers?
No. A plain-English answer comes from the same sales and web data as the dashboards, shown as a table and a chart you can check.
Can it show whether website traffic turns into orders?
Yes. The overview shows web orders per 100 visits, net sales per visit and the web share of sales. Because visits and orders come from different systems, it’s labeled as an approximate conversion.
Works alongside
Every Commergenix module shares one sign-in, one job engine, and one set of integrations, so each one you add makes the others more useful.
Quote IQ
An embeddable spec-to-quote assistant. It reads a customer’s requirements or documents, asks follow-up questions, and delivers a complete quote request to your team.
Learn more →Price Director
Live metal prices, including copper and aluminum, with 90-day trends and pricing rules that respond to metal costs.
Learn more →OrderFlow
Won quotes become checked, approved ERP orders, and every open order is followed through the plant until it ships.
Learn more →See your sales and your website side by side.
Tell us which commerce platform and analytics you run, and the reports your team builds by hand today. We’ll show you where Channel IQ helps and tell you honestly where it doesn’t.